Today's forecast for U.S. Treasury yields is based on the June 20, 2013, constant maturity Treasury yields that were reported by the Board of Governors of the Federal Reserve System in its H15 Statistical Release at 4:15 p.m. ET on June 21, 2013. The forecast for primary mortgage market yields and the resulting mortgage servicing rights valuations are derived in part from the Federal Home Loan Mortgage Corporation Primary Mortgage Market Survey made available on the same day.
The U.S. Treasury "forecast" is the implied future coupon bearing U.S. Treasury yields derived using the maximum smoothness forward rate smoothing approach developed by Adams and van Deventer (Journal of Fixed Income, 1994) and corrected in van Deventer and Imai, Financial Risk Analytics (1996). The primary mortgage yield forecast applies the maximum smoothness approach to primary mortgage market credit spreads, which embed the risk neutral probabilities of mortgage default and prepayment risk. References explaining this approach are given below.
U.S. Treasury Yield Forecast
This week's projections for the one-month Treasury bill rate (investment basis) steepen dramatically at 2015 resulting in higher forecasts at the intermediate and long ends. The projected one-month rate of 4.165% in May 2023 is up 13 basis points from last week. The 10-year U.S. Treasury yield is projected to rise steadily to reach 4.302% on May 31, 2023, 17 basis points higher than projected last week.
(click to enlarge)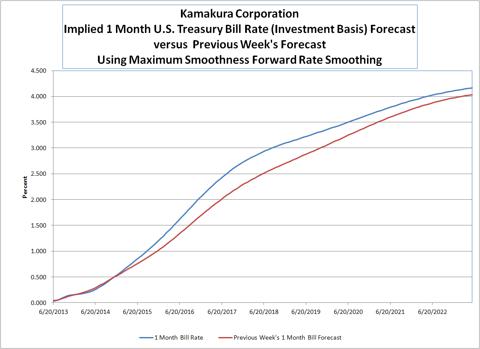
Mortgage Valuation Yield Curve and Mortgage Yield Forecast
The zero coupon yield curve appropriate for valuing mortgages in the primary mortgage market is derived from new issue effective yields reported by the Federal Home Loan Mortgage Corporation in its Primary Mortgage Market Survey. The maximum smoothness credit spread is produced so that this spread, in combination with the U.S. Tre! asury curve derived above, correctly values new 15-year and 30-year fixed rate mortgages at their initial principal value less the value of points. The next graph compares the implied 15-year fixed rate mortgage yield with the implied 15-year U.S. Treasury fixed rate amortizing yield over the next ten years.
(click to enlarge)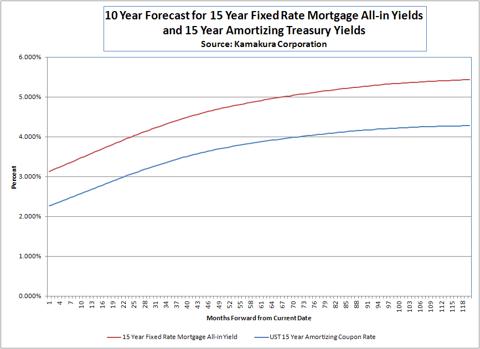
The effective yield on 15 -ear fixed rate mortgages is projected to rise from 3.141% today to 5.443% in 10 years, down 3 basis points compared to last week. The 15-year fixed rate mortgage spread over 15-year amortizing Treasury yields is forecasted to widen from its current level of 0.865% to 1.157% in 10 years, down 19 basis points from last week.
Implied Valuation of Mortgage Servicing Rights
Using the insights of Prof. Robert Jarrow noted below, we have derived the risk-neutral values of mortgage cash flows, which are based on market implied default risk and prepayment risk. We use these zero coupon bond prices to value mortgage-related cash flows relevant to mortgage servicing rights. These zero coupon bond prices, when multiplied by current primary mortgage market terms, value new mortgages at their principal value less the value of points:
(click to enlarge)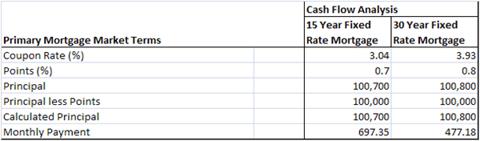
Today's implied mortgage valuation yield curve results in the following risk-neutral valuation split between interest-only and principal-only cash flows:
(click to enlarge)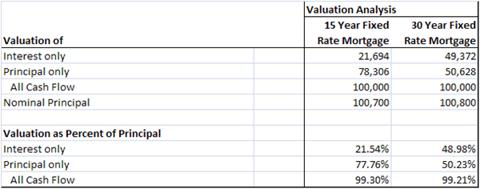
We apply the same mortgage valuation yield curve zero coupon bond prices to various levels of net servicing fees to get their risk-neutral present value in today's market:
(click to enlarge)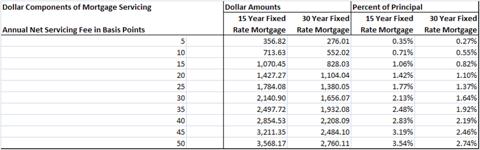
If ! we use th! e market convention that the net cost to service is a constant dollar amount, the risk-neutral present value of the net cost to service can be derived using the same zero coupon bond prices from the mortgage valuation yield curve.
(click to enlarge)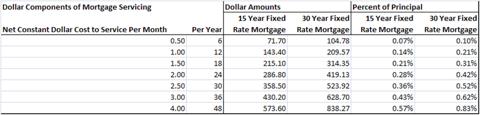
Next, we value float per $100 of taxes and insurance on the underlying home. We assume that float is invested at the matched maturity U.S. Treasury forward rate for the matching float period below. The risk-neutral present value of the interest earned is calculated using the mortgage valuation yield curve, since an event of default or prepayment on the underlying mortgage ends this source of value. Value for a constant $100 amount is given here for "float periods" ranging from one-quarter of a month to a full month:
(click to enlarge)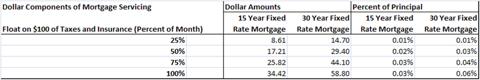
Again, the same analysis can be done on an inflation adjusted basis with insurance and taxes tied to the value of the home. The value of float on the payment of interest and principal for various lengths of the "float period" is given in this table:
(click to enlarge)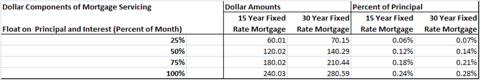
Another important component of mortgage servicing rights valuation is the net impact of cash flows to the servicer from the events of default and prepayment. We can analyze this by asking this question: What would be the value of the mortgage if there were no events of default or prepayment? The answer is obtained by applying U.S. Treasury zero coupon bond rates to the scheduled mortgage cash flows. This table shows the net reduction in certain monthly cash flow that would be necessary for the value of the mortgage to adjust downward from this "no default/no prepayment value" to its current market valu! e, discou! nted by the U.S. Treasury zero coupon bond prices. This adjusted basis converts the random probability of losses from prepayment and default to a known, certain cost of prepayment and default in the form of this "implied net constant monthly cash flow reduction." The division of this negative cash flow impact between the servicer and other parties depends on the term of the servicing contract:
(click to enlarge)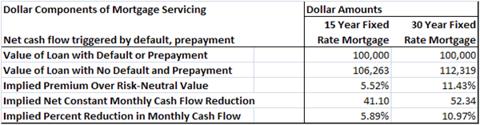
Background Information on Input Data and Smoothing
The Federal Reserve H15 statistical release is available here.
The maximum smoothness forward rate approach to yield curve smoothing is detailed in Chapter 5 of van Deventer, Donald R., Kenji Imai and Mark Mesler, 2013, Advanced Financial Risk Management, 2nd edition, John Wiley & Sons, Inc., Singapore. The smoothing process for the maximum smoothness credit spread, derived from coupon-bearing bond prices, is given in Chapter 17 of van Deventer, Imai and Mesler (2013). Additional information on the maximum smoothness forward rate approach can be found at this link.
The maximum smoothness approach to credit spread smoothing is available at this related link.
The academic paper outlining the Jarrow-van Deventer approach to mortgage yield curve derivation was published in The Journal of Fixed Income: Jarrow, Robert A. and Donald R. van Deventer, "A Simple, Transparent and Accurate Mortgage Valuation Yield Curve," The Journal of Fixed Income, Winter 2013, Vol. 22, No. 3, pages 37-44.
The mortgage valuation yield curve insights depend heavily on this important paper: Jarrow, Robert A., "Risky Coupon Bonds as a Portfolio of Zero-Coupon Bonds," Finance Research Letters, 1, no. 2 (June 2004) pp. 100-105.
Today's U.S. Treasury Yield Forecast
The 10-year monthly forecast of U.S. Treasury yields is based on this data from the Federal Reserve H15 statistical release:
The graph below shows in three dimensions the movement of the U.S. Treasury yield curve 120 months into the future at each month-end:
(click to enlarge)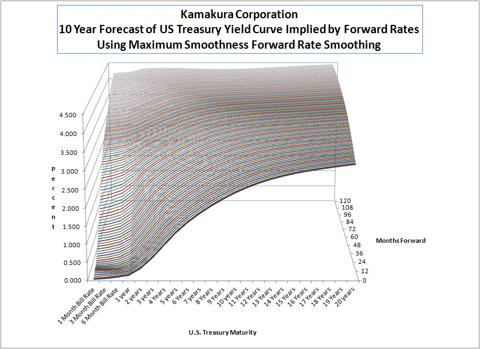
These yield curve movements are consistent with the continuous forward rates and zero coupon yields implied by the U.S. Treasury coupon bearing yields above:
(click to enlarge)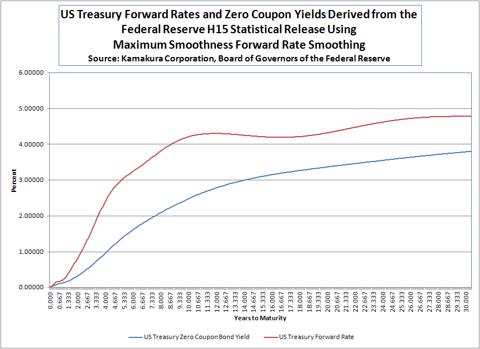
In numerical terms, forecasts for the first 60 months of U.S. Treasury yield curves are as follows:
(click to enlarge)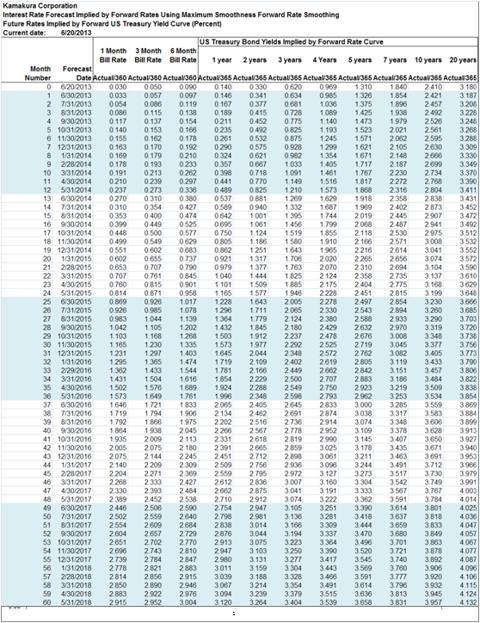
The forecast yields for months 61 to 120 are given here:
(click to enlarge)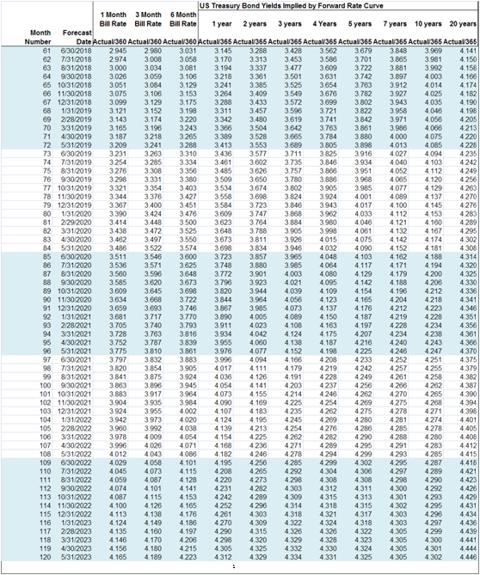
Today's Forecast for Effective Primary Mortgage Market Yields
Today's forecast for the mortgage valuation yield curve is based on the following data from the Federal Home Loan Mortgage Corporation Primary Mortgage Market Survey:
(click to enlarge)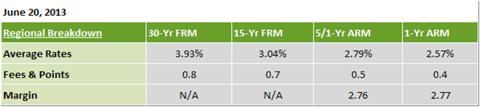
Only fixed-rate mortgage data is used in this analysis in order to avoid the more complex embedded options found in floating rate mortgages, with the risk that the mortgage valuation yield curve of fixed and floating rate mortgages is not identical. Applying the maximum smoothness forward rate smoothing approach to the forward credit spreads between the mortgage valuation yield curve and the U.S. Treasury curve results in the following zero coupon bond yields:
(click to enlarge)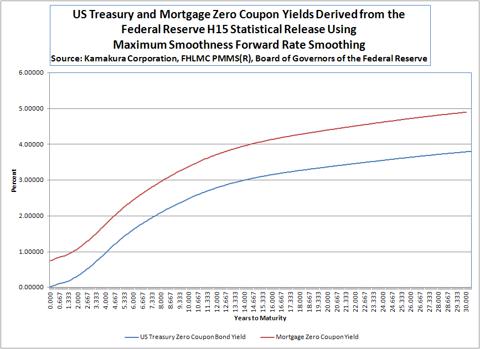
The forw! ard rates! for the mortgage valuation yield curve and U.S. Treasury curve are shown here:
(click to enlarge)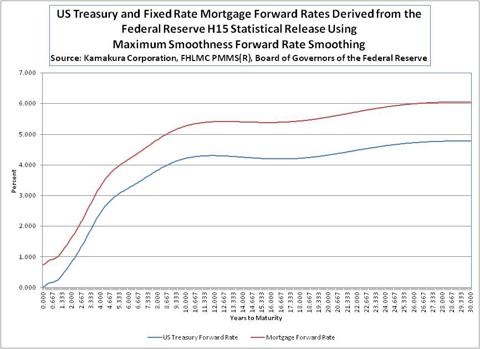
Note: This mortgage analysis is updated weekly. Additional information is available from the author at info@kamakuraco.com.
Disclosure: I have no positions in any stocks mentioned, and no plans to initiate any positions within the next 72 hours. I wrote this article myself, and it expresses my own opinions. I am not receiving compensation for it. I have no business relationship with any company whose stock is mentioned in this article. (More...)
No comments:
Post a Comment